
What Is Sales Reporting? Types, Tips & Best Practices

Most sales teams have plenty of data. The problem is that it's scattered across multiple systems. The CRM has some of it, spreadsheets have the rest, and your field reps are managing orders on top of that. As a result, sales teams waste 20-30% of their time manually pulling and reconciling data, with reps losing 8-10 hours per week to CRM and admin work alone. By the time you put all the data together, the moment to act on it has already passed.
Sales reporting, coupled with centralized data, can remedy this. Aggregating all that scattered data into a clear, organized view of how your team is performing and where your revenue is coming from helps you figure out what needs to happen next.
In this guide, we'll break down what sales reporting is, the main types of reports your B2B team should know, and the best practices that separate useful reports from ones that just sit in an inbox.
INDEX
What Is a Sales Report?
Why Sales Reporting Matters for B2B Teams
Key Elements to Include in a Sales Report
Types of Sales Reports
How to Create a Sales Report Step by Step
Common Mistakes to Avoid in Sales Reporting
Tools That Power Better Sales Reporting
FAQs
What should be in a sales report?
What is a sales pipeline report?
What is a gross sales report?
How do I make a sales report?
How often should sales reports be generated?
What Is a Sales Report?
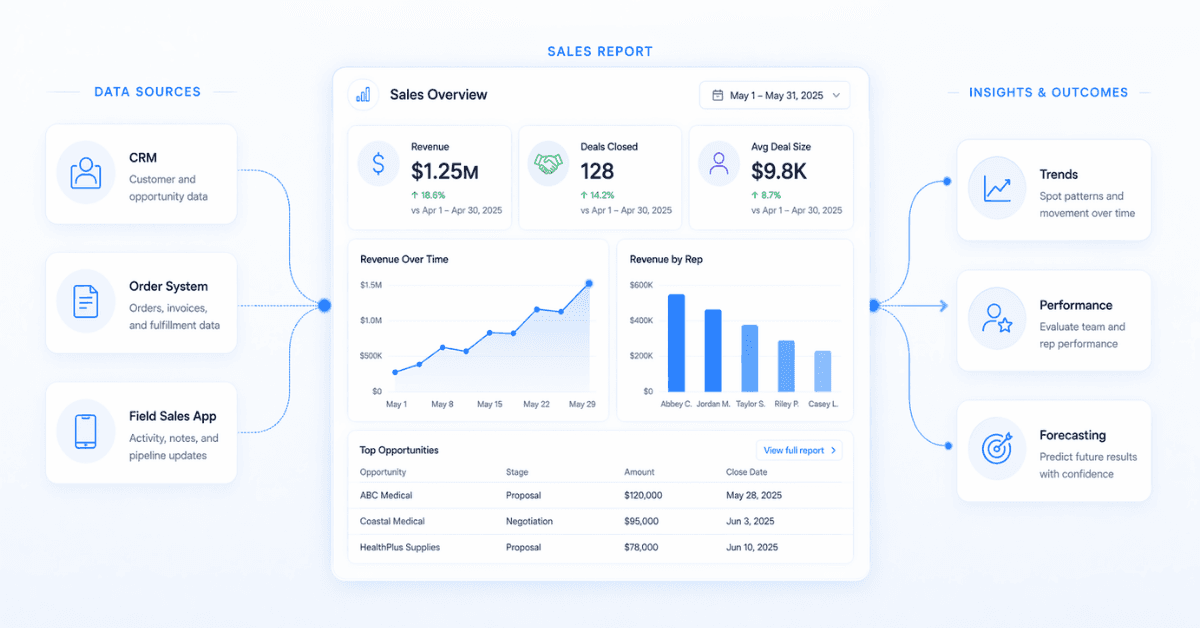
A sales report is a document, or a dashboard, that organizes your sales data for a specific time period so you can understand how your business is performing.
It pulls information from your CRM, your order management system, and other tools your team uses, and turns it into something readable: numbers, trends, charts, and insights.
Sales reports can cover your entire team, a single sales rep, a specific product line, a region, or a channel. And they can be generated daily, weekly, monthly, or quarterly, depending on who's reading them and what decisions they need to make.
For B2B teams with field sales reps, e-commerce orders, and multiple channels all running at the same time, a good sales report is what keeps a lot of data from turning into noise.
Why Sales Reporting Matters for B2B Teams
Sales reporting isn't just about knowing your revenue number. Here's what it actually does for your business:
It gives you real visibility. You can see which reps are closing, which channels are converting, and where deals are getting stuck, instead of guessing, helping teams make decisions 15-25% faster.
It makes forecasting more reliable. When you have consistent historical data, you can project future revenue with a lot more confidence, improving forecast accuracy by 20-40%.
It shows you where the funnel breaks. If you're losing deals at the same stage over and over, a report will catch it before it becomes a bigger problem. Companies that track funnel stages reduce deal loss by 10-20%.
It enables better coaching. Instead of checking in with your reps constantly, you can look at the data and have targeted, specific conversations, which can increase rep performance by up to 30%.
It keeps commissions clean. In B2B teams with territory structures and variable comp, reporting is how you verify that every order is assigned to the right rep and every commission is calculated correctly, especially when manual errors can impact 8-12% of payouts.
It reduces operational chaos. When field sales, e-commerce, and customer service are all generating orders, a centralized report is what keeps everyone working in the same reality.
Key Elements to Include in a Sales Report
The content of a sales report depends on who's reading it and why, but most effective reports share a few core components.
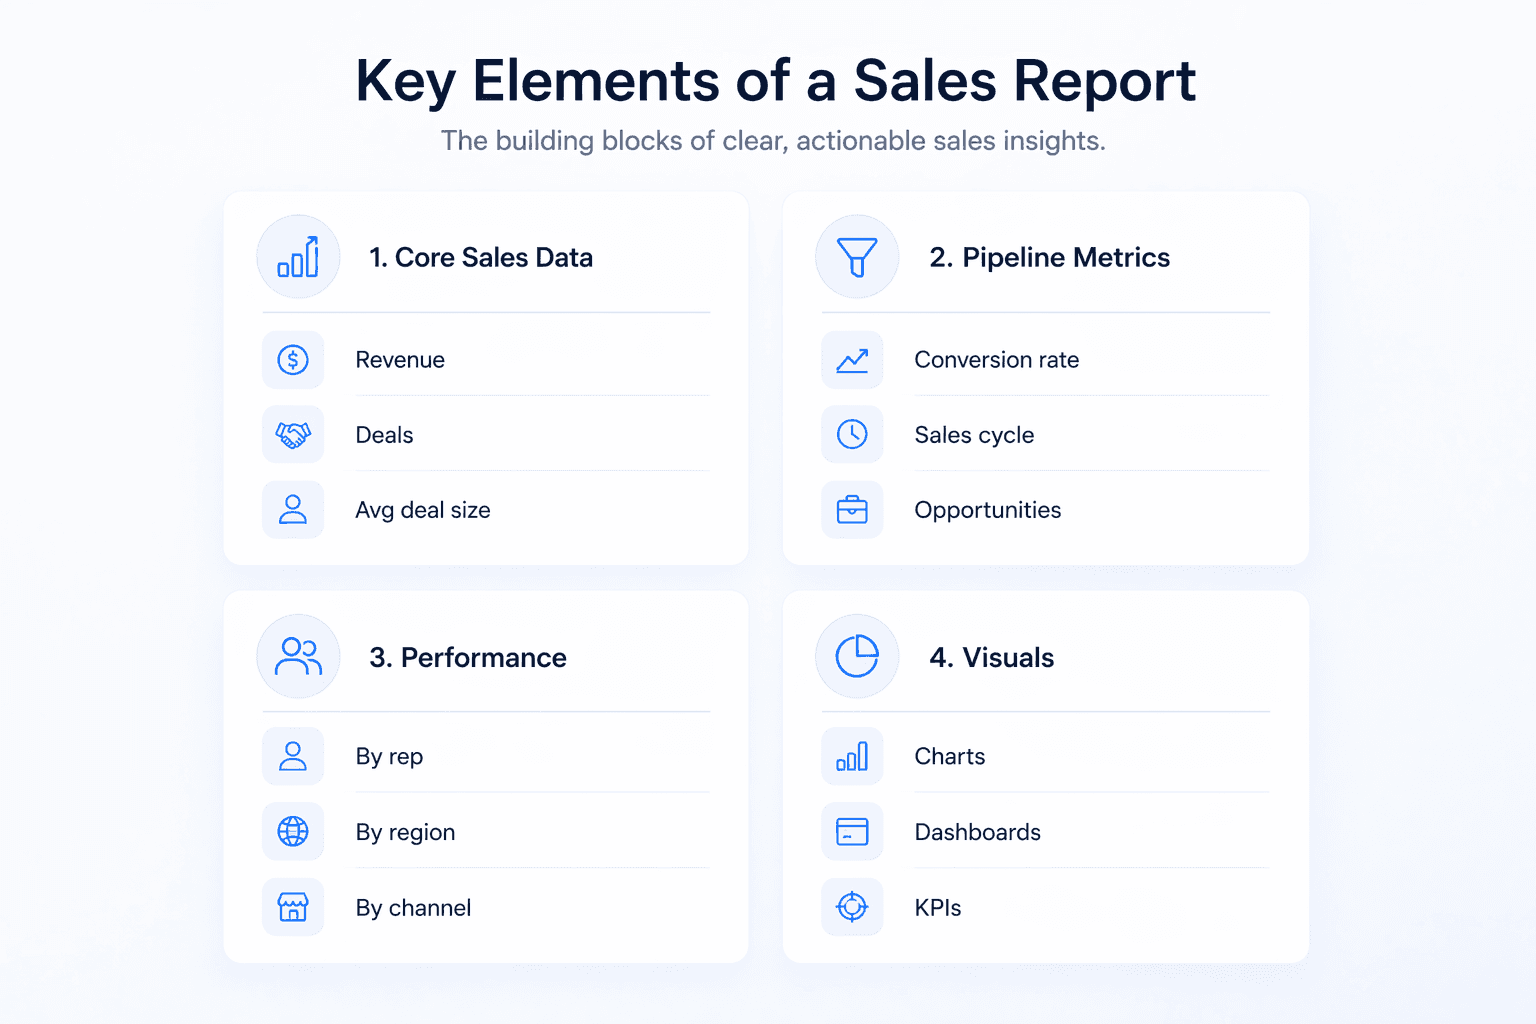
Core Sales Data
This is the foundation of any report:
Total revenue for the period (gross sales and net sales, more on the difference below)
Number of closed deals or orders
Average order or deal size
Upsells, add-ons, and renewals
Pipeline and Activity Metrics
This tells you where things stand right now, where your opportunities are, and how hard your team is working:
Active opportunities by stage
Lead-to-close ratio and conversion rate
Average sales cycle length
Activity by rep: calls, meetings, follow-ups, first orders placed in the field
Performance by Rep, Territory, or Channel
This is where B2B reporting gets specific:
Revenue by rep and by territory
Orders captured by channel: field sales, e-commerce, customer service
Win rate by rep or region
Top products or SKUs by volume or margin
Commissions earned per rep, a critical data point for teams with field reps
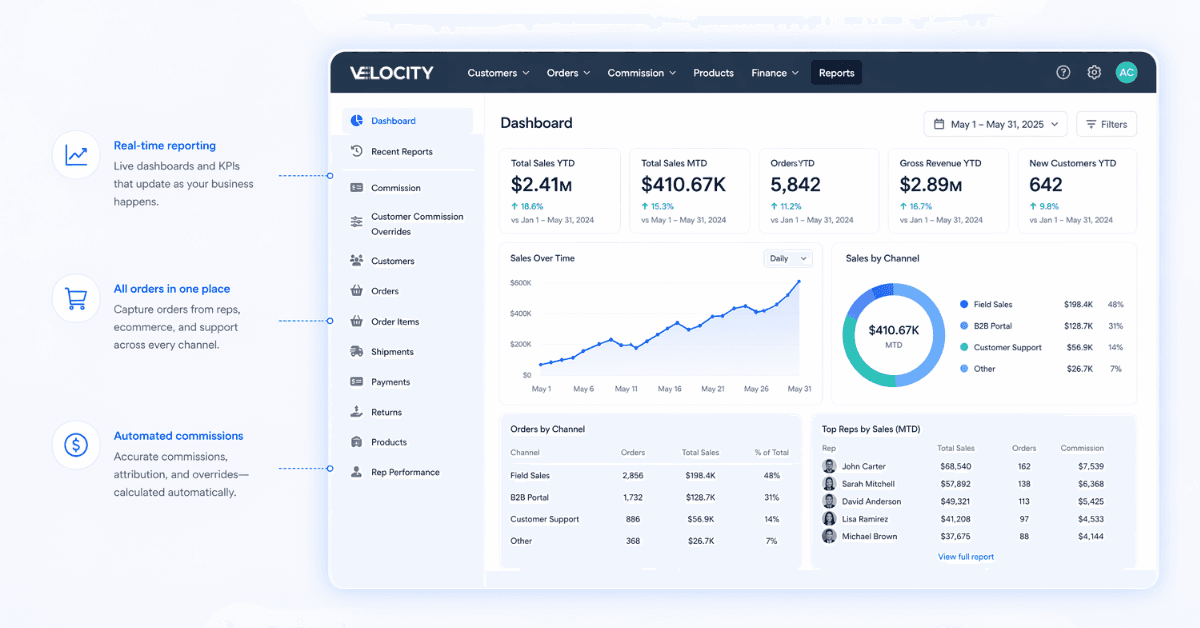
Visual Elements
Numbers alone are hard to scan. Good reports include:
Bar charts, line graphs, or pie charts to show trends at a glance
Comparison tables against previous periods or targets
Dashboards with live KPIs (year-to-date, month-to-date) for ongoing monitoring
Conditional formatting or annotations to flag anything unusual
Types of Sales Reports
Not every report serves the same purpose. Here are the main types and what they're used for.
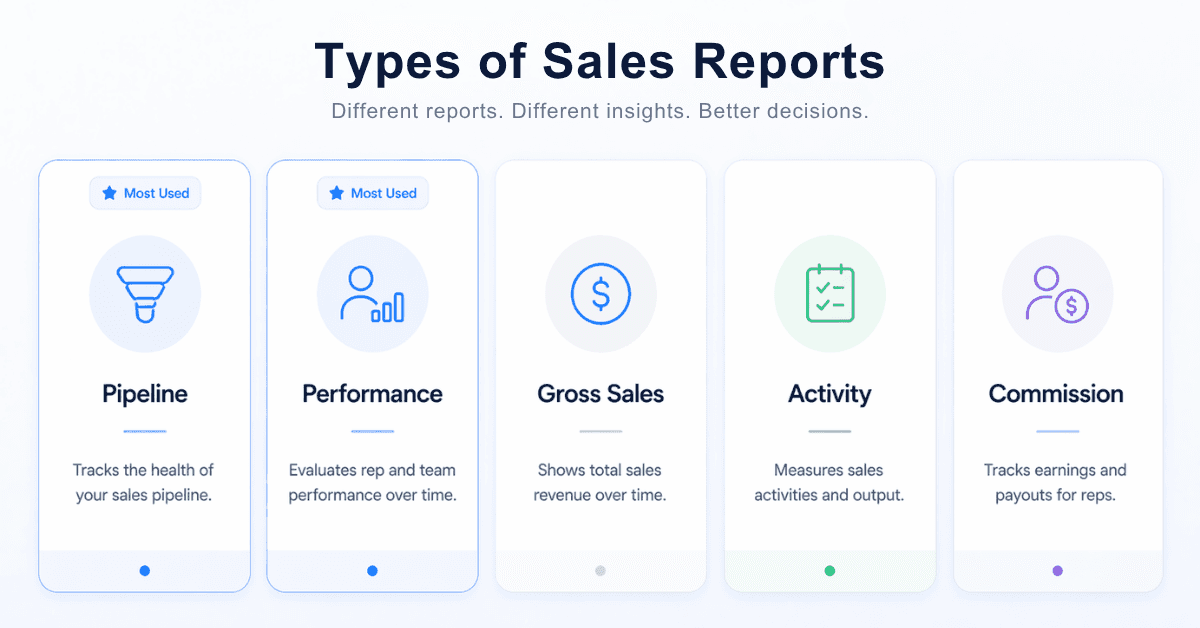
Sales Pipeline Report
A pipeline report shows all your active deals organized by stage, along with their value and expected close date.
Sales managers use it to see which deals need attention and whether there's enough volume in the pipeline to hit the revenue target. It's also the foundation of weighted forecasting, where each deal gets a probability based on its stage and historical conversion rate.
One thing to watch in B2B: if your field reps are placing orders outside your CRM, those deals may not show up in your pipeline report at all. That's a blind spot that adds up fast.
Sales Performance Report
This report compares closed revenue against quota or target. It works at the individual, team, and regional levels.
It's what you use for performance reviews, comp decisions, and territory adjustments. If someone is consistently underperforming, a performance report shows you exactly where and by how much.
Gross Sales Report
A gross sales report shows your total sales revenue before any deductions. Returns, discounts, and allowances are not subtracted yet.
It reflects raw sales volume across all channels and is useful for measuring overall commercial activity. The difference between gross and net sales is simple: gross is everything you sold, net is what you kept after adjustments.
In B2B environments with multiple channels and frequent discounting, a gross sales report is a good starting point, but it needs to be read alongside net sales to get the full picture.
Sales Activity Report
An activity report tracks what your team is actually doing: calls made, emails sent, demos booked, meetings held, orders placed from the field.
It helps you connect effort to results. If a rep has low revenue numbers, an activity report can tell you whether it's a volume problem (not enough activity) or a conversion problem (plenty of activity, but it's not closing).
This one is especially useful for field sales teams whose day-to-day work isn't always visible from the office.
Commission Report
A commission report breaks down what each rep has earned, by order or by period. It's non-negotiable for any team with variable comp structures or territory-based hierarchies.
When commissions are calculated manually or in a spreadsheet separate from your order data, errors are common. And when a rep disputes their commission, tracing it back through fragmented records is a painful process for everyone involved.
Velocity handles this automatically. Its Territory Mapping and Commissions module calculates commissions at the order level and gives each rep real-time visibility into what they've earned, reducing errors by over 80% and eliminating the need for extra spreadsheet work.
How to Create a Sales Report Step by Step
Here's a straightforward process you can follow regardless of your tools or team size.
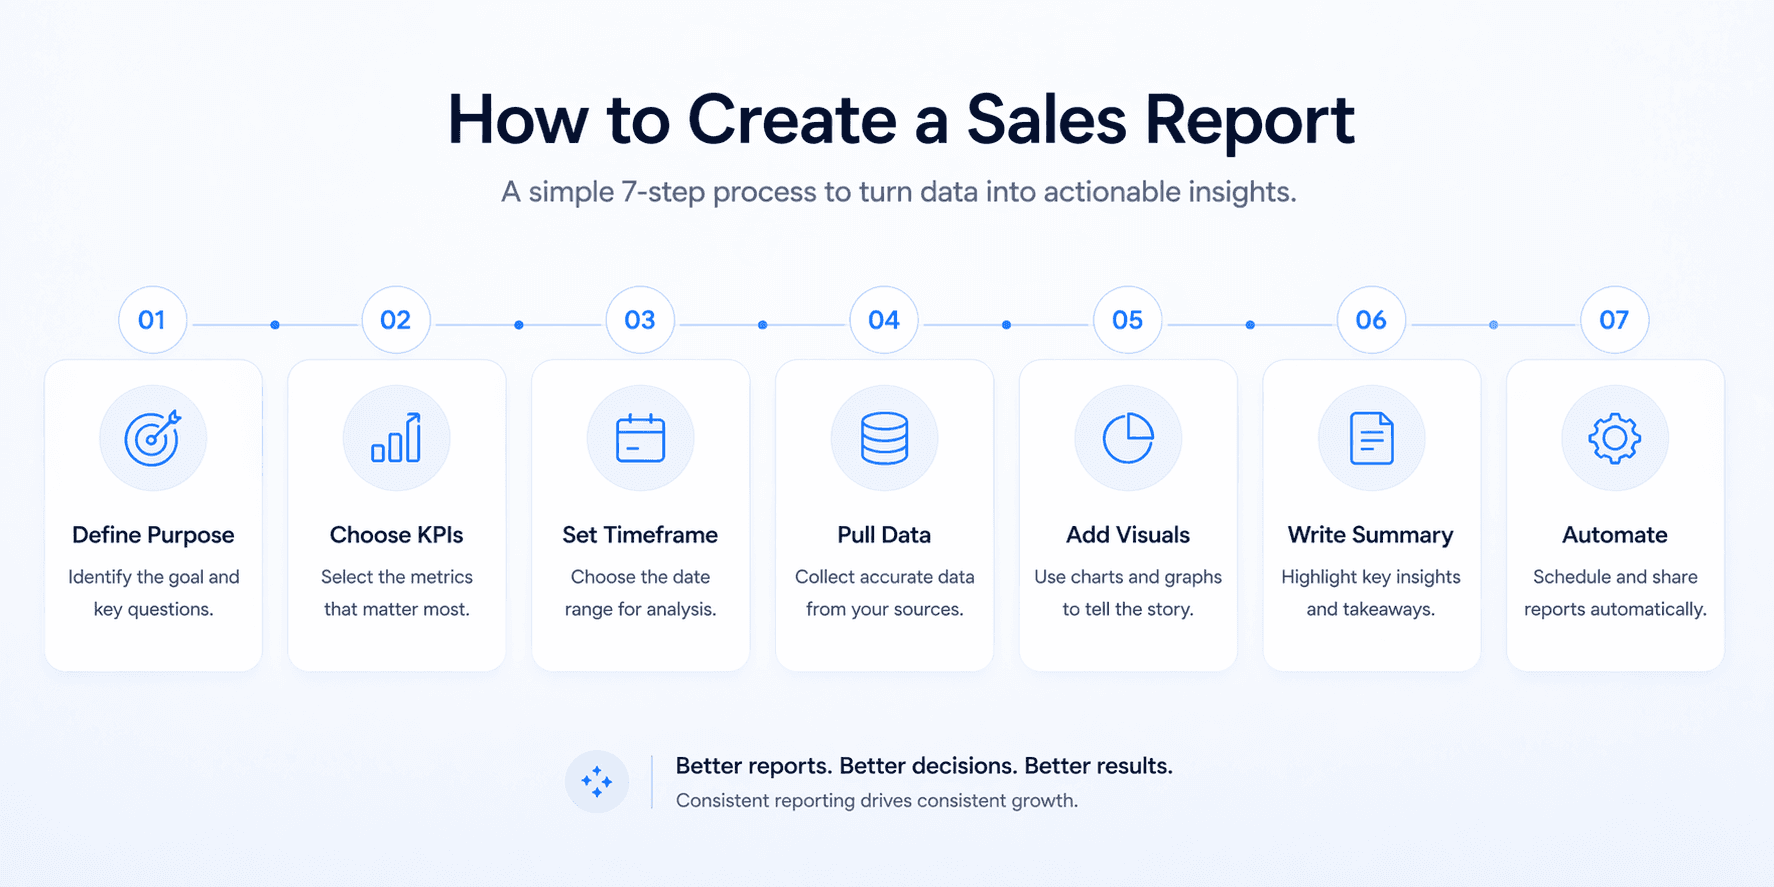
Step 1: Define the purpose and audience.
Who is this for, and what decision does it need to support? A weekly report for a field sales manager looks very different from a monthly report for the VP of Sales.
Step 2: Choose your KPIs.
Pick the metrics that answer your specific question. Resist the urge to include everything. Reports that try to show too much end up showing nothing clearly.
Step 3: Set the time frame.
Lock in a consistent start and end date for all the data in the report. Include a comparison period (previous month, same period last year) so the numbers have context.
Step 4: Pull data from the right sources.
Your CRM is the starting point for pipeline and performance data. But in B2B, you also need your order management platform to capture field orders, e-commerce transactions, and customer service orders in one place. If those aren't unified, your report will be missing data.
Step 5: Add visuals.
Charts and dashboards make trends visible in seconds. Most modern tools generate these automatically from your data. You shouldn't be building graphs manually.
Step 6: Write a short summary.
Highlight the 3 to 5 most important takeaways: what's working, what's at risk, and what the team should focus on next.
Step 7: Set a cadence and automate delivery.
Reports that get built ad hoc don't get built consistently. Set a schedule (daily for reps, weekly for managers, monthly for leadership) and use a tool that sends them automatically to the right people.
Common Mistakes to Avoid in Sales Reporting
Reporting without a clear purpose.
If you're not sure why a metric is in the report, it probably shouldn't be.
Fragmented data.
If your field orders, e-commerce orders, and customer service orders live in different systems, your reporting may only tell part of the story. Worse, the numbers may not add up, and that erodes trust in the report itself.
One report for everyone.
A rep needs to see their own pipeline and commissions. A manager needs team-level trends. An exec needs revenue vs. target. Trying to serve all three with the same document usually serves none of them well.
Commissions tracked outside the system.
When commission inputs live in a separate spreadsheet, it can create delays, disputes, and errors. Reps lose trust in the numbers, and ops teams spend time reconciling instead of analyzing.
Missing context.
A sharp drop in one week might be a system outage, a holiday, or a pricing change, not a sales problem. Always note what was happening in the business during the period you're reporting on.
Not acting on it.
A report that sits in an inbox and doesn't lead to a decision or a conversation isn't doing its job.
Tools That Power Better Sales Reporting
The quality of your reports depends entirely on the quality of your data. Here are the layers most B2B teams work with:
CRM: The primary source for pipeline, contacts, and deal history. Most reporting starts here.
BI tools: Useful for more complex analysis and cross-platform dashboards in larger organizations.
ERP and financial systems: Connect sales data to invoicing, inventory, and financial planning.
Order management platforms: In B2B, the CRM may not capture the full order picture, especially when field reps, e-commerce, and customer service are all generating orders through different channels.
That's where Velocity Commerce comes in. It centralizes orders from field sales, e-commerce, and customer service into a single platform, automatically assigns them to the right rep, and gives your team real-time visibility into orders, shipments, commissions, and customers.
Velocity’s Custom Reporting module lets you build self-service reports using live data, schedule automatic delivery to individuals or distribution lists on a daily or weekly basis, and monitor KPIs through custom dashboards with YTD and MTD views built in. No manual exports, no chasing data across systems.
Your reporting is only as good as your data - having every order in one place isn't a nice-to-have, it's the necessary foundation for long-term success.
FAQs
What should be in a sales report?
At minimum: total revenue, number of closed deals or orders, average deal size, conversion rates, pipeline by stage, and performance by rep or territory. For B2B teams, you should also include commission data, channel breakdowns, and a short written summary with key insights and next steps.
What is a sales pipeline report?
A pipeline report shows all your active deals organized by stage, with their value and expected close date. Managers use it to spot which deals need attention and whether the team has enough pipeline to hit its targets. In B2B, it should also reflect orders placed by field reps, not just deals tracked in the CRM.
What is a gross sales report?
A gross sales report shows your total revenue before returns, discounts, or allowances are subtracted. It reflects raw sales volume across all channels and is useful for comparing periods or measuring overall commercial activity. The difference from net sales: gross is everything you sold, net is what you kept after adjustments.
How do I make a sales report?
Define your audience and purpose first. Then choose the right KPIs, set a consistent time frame, pull data from your CRM and order management platform, add visuals to make trends easy to read, and close with a written summary of key takeaways and next steps. Set a regular cadence and automate delivery so it actually happens consistently.
How often should sales reports be generated?
Reps typically review daily or weekly reports to track their own pipeline, orders, and commissions. Managers work with weekly or monthly team-level reports. Executives and leadership usually focus on monthly or quarterly reports that show revenue trends and forecast accuracy.
Final Thoughts
A sales report isn't a formality. It's how you turn what your team is doing every day into something you can actually learn from and act on.
For B2B teams with field reps, multiple channels, and complex commission structures, that means more than just connecting a CRM to a dashboard. It means making sure every order, wherever it came from, is captured, assigned, and visible in one place.
When that's in place, your reports stop being a chore and start being one of the most useful tools your team has.
Ready to bring all your orders and sales data together? See how Velocity works.