
B2B Ecommerce KPIs: The Sales Ops & Finance Reporting Checklist

Most B2B sellers don’t have a metrics problem. They have a reporting problem. The numbers exist, but they’re scattered across spreadsheets, ecommerce platforms, and customer service inboxes, so no two reports ever agree.
B2B ecommerce KPIs measure whether your orders, customers, and revenue are moving in the right direction across every sales channel. Choosing the right KPIs isn’t the hard part. The challenge is getting consistent numbers when the same customer orders through a rep on Monday and reorders online on Thursday. This guide breaks down the B2B KPIs that matter most, groups them by how your Sales Ops and Finance teams report, and ends with a weekly checklist you can run without chasing data.
TL;DR: B2B ecommerce KPIs fall into five groups: revenue and growth, customer and retention, ordering and conversion, fulfillment and operations, and rep and commission. Track average order value, customer lifetime value, retention rate, repeat order rate, conversion rate, order accuracy, and on-time delivery as your core KPIs. Your KPIs are only as reliable as the system feeding them, so a single source of truth for orders is what makes weekly reporting trustworthy. Use the checklist at the end to assign each KPI to an owner and review cadence. |
|---|
INDEX
What Are B2B Ecommerce KPIs?
Why Fragmented Orders Break KPI Reporting
Revenue and Growth KPIs
Customer and Retention KPIs
Ordering and Conversion KPIs
Fulfillment and Operations KPIs
Rep and Commission KPIs
The Weekly B2B Ecommerce KPI Checklist
What Are B2B Ecommerce KPIs?
B2B ecommerce KPIs are measurable indicators of how your sales operation performs across orders, customers, revenue, and fulfillment. They help identify which customers to reinvest in, which channels are growing, and where orders are slipping before they reach the customer.
B2B metrics behave differently than B2C metrics. Order values are larger, purchase cycles repeat on contracts and reorders rather than impulse, and a single customer relationship can run for years across multiple buyers and locations. That’s why KPIs like repeat order rate matter far more in B2B than one-time conversions. The right KPIs reflect those long-term, multi-channel relationships instead of relying on a consumer-focused dashboard.
Channel mix matters, too. A rep-led order, a self-service reorder through a B2B customer portal, and a customer service order correction all represent the same transaction through different channels. When those transactions stay aligned across every channel, your KPIs reflect a single, accurate picture. When they do not, every report tells a different story.
Why Fragmented Orders Break KPI Reporting
The biggest threat to B2B ecommerce KPIs is not picking the wrong metric. It is measuring the right metric against fragmented data. Reps enter orders in one system, the ecommerce platform captures another, and finance reconciles a third version at month end. Each system is internally consistent, but together they create conflicting reports.

This is where a single source of truth for orders changes everything. When pricing, commissions, inventory, and customer data stay aligned across every channel, a KPI reported on Tuesday is still accurate on Friday. Velocity Commerce brings together orders from field reps, ecommerce, and customer service into one platform so every KPI is built from the same trusted data. The result is reporting your Sales Ops and Finance teams can defend.
Unifying the data is only step one. You still need the right groups of KPIs, and you need to know who owns each one. The five categories below map to how B2B teams actually divide reporting responsibility.
Revenue and Growth KPIs
Revenue KPIs answer the first question every stakeholder asks: Is the business growing, and where is that growth coming from? In B2B, the answer is rarely that simple. Growth comes from order size, channel mix, and the long-term value of each customer relationship.
Average Order Value (AOV). Total revenue divided by number of orders. In B2B, this is your fastest read on whether bundling, tiered pricing, and rep upsell are working. A rising AOV on flat order counts usually means your reps and catalog are doing their job.
Total Revenue by Channel. Revenue split across rep-led, self-service, and customer service orders. This tells you which channels are pulling weight and which deserve more investment, and it only works when every channel reports into one system.
Customer Lifetime Value (CLV). The total revenue you expect from a customer across the full relationship. B2B CLV dwarfs B2C because contracts renew and reorders compound, so even a small retention gain moves this number a lot.
Revenue Growth Rate. Period-over-period revenue growth, tracked monthly and quarterly. Pair it with channel-level reporting so a strong month doesn’t hide declines in a specific channel.
The goal isn’t simply to measure revenue. It’s understanding which customers and channels generate durable, repeatable revenue – something only clean, unified order data can support.
Customer and Retention KPIs
Customer KPIs measure the health of your customer relationships, and in B2B, those relationships drive the business. Acquiring a new wholesale or distribution customer is expensive and slow, so keeping and growing existing ones is where the margin lives.
Customer Acquisition Cost (CAC). Total sales and marketing spend divided by new customers won. High CAC is tolerable in B2B if CLV is high enough, so always read these two together.
Customer Retention Rate. The percentage of customers who keep buying across a period. This is the single most telling B2B health metric, because retention compounds into the CLV that justifies your acquisition spend.
Churn Rate. The inverse of retention, and an early warning system. Rising churn among key customers often appears as declining reorder frequency before it shows up as lost revenue.
Repeat Order Rate. The share of customers placing more than one order in a period. For rep-led and hybrid sales teams, this is the clearest proof that onboarding and self-service reordering are working.
Retention isn’t just a sales outcome. It’s also an operational one, because customers leave when orders arrive late or wrong. That’s why fulfillment KPIs belong on the same dashboard.
Ordering and Conversion KPIs
Ordering KPIs measure how efficiently buying intent turns into completed orders, whether a rep is building a cart or a customer is reordering online. B2B conversion differs from B2C, since much of it happens within negotiated catalogs and customer-specific pricing rather than open browsing.
Conversion Rate. Orders divided by sessions or qualified opportunities, measured per channel. A low online conversion rate with strong rep conversion often points to friction in the self-service experience, not a demand problem.
Cart Abandonment Rate. The percentage of started orders that are never completed. In B2B, abandonment frequently signals friction caused by unclear net terms, missing PO fields, or pricing that does not match the customer's agreement.
Average Order Frequency. How often a given customer orders within a period. Rising frequency is one of the strongest signals that a customer is healthy and your reorder flow is frictionless.
So when conversion dips, resist the urge to blame demand first. More often, the order path itself is leaking, and the fix lives in how cleanly orders are captured and submitted.
Fulfillment and Operations KPIs
Fulfillment KPIs measure what happens after the sale, and in B2B, a broken promise can cost a customer relationship, not just a return. These metrics connect operations and customer experience, and they are where reporting gaps do the most damage.
Order Accuracy Rate. The percentage of orders shipped complete and correct. Errors here erode retention faster than almost anything, and they multiply when orders are rekeyed between systems.
On-Time Delivery Rate. The share of orders delivered by the promised date. Track this alongside shipment and backorder reporting so a strong delivery average does not hide a problem segment.
Backorder Rate. The percentage of order lines that cannot ship on time due to stock. A rising backorder rate is both an inventory signal and a retention risk, so it belongs in front of Sales Ops weekly, not buried in a warehouse report.
But none of these numbers is trustworthy if fulfillment data lives apart from order data. When the order, the shipment, and the customer record share one system, accuracy and delivery become measurable instead of anecdotal.
Rep and Commission KPIs
Rep KPIs connect field activity to revenue, and commission KPIs make sure the people driving that revenue are paid correctly and on time. For rep-led and hybrid teams, these metrics are where motivation and reporting meet.
Orders and Revenue per Rep. Revenue and order performance by rep across assigned customers, used for coaching—not just ranking. Reps should see only their own customers, orders, and commissions, keeping the data clean and the comparison fair.
Commission Accuracy. The percentage of commission calculations that are correct on the first run. Manual commission math is a quiet KPI killer, since disputes consume hours and erode trust. Automated, rules-based commission management turns this into a number you can actually report on.
Across all five categories, the same principle applies: every metric is only as reliable as the system behind it. With orders, customers, and commissions in one place, every KPI above becomes a weekly habit instead of a monthly reconstruction.
The Weekly B2B Ecommerce KPI Checklist
If you can't pull a KPI on Monday morning, it isn't helping your business – it's become a research project. The point of unifying your order data is that reporting becomes routine. Assign each KPI to an owner and review cadence, and your weekly reporting takes minutes instead of hours.
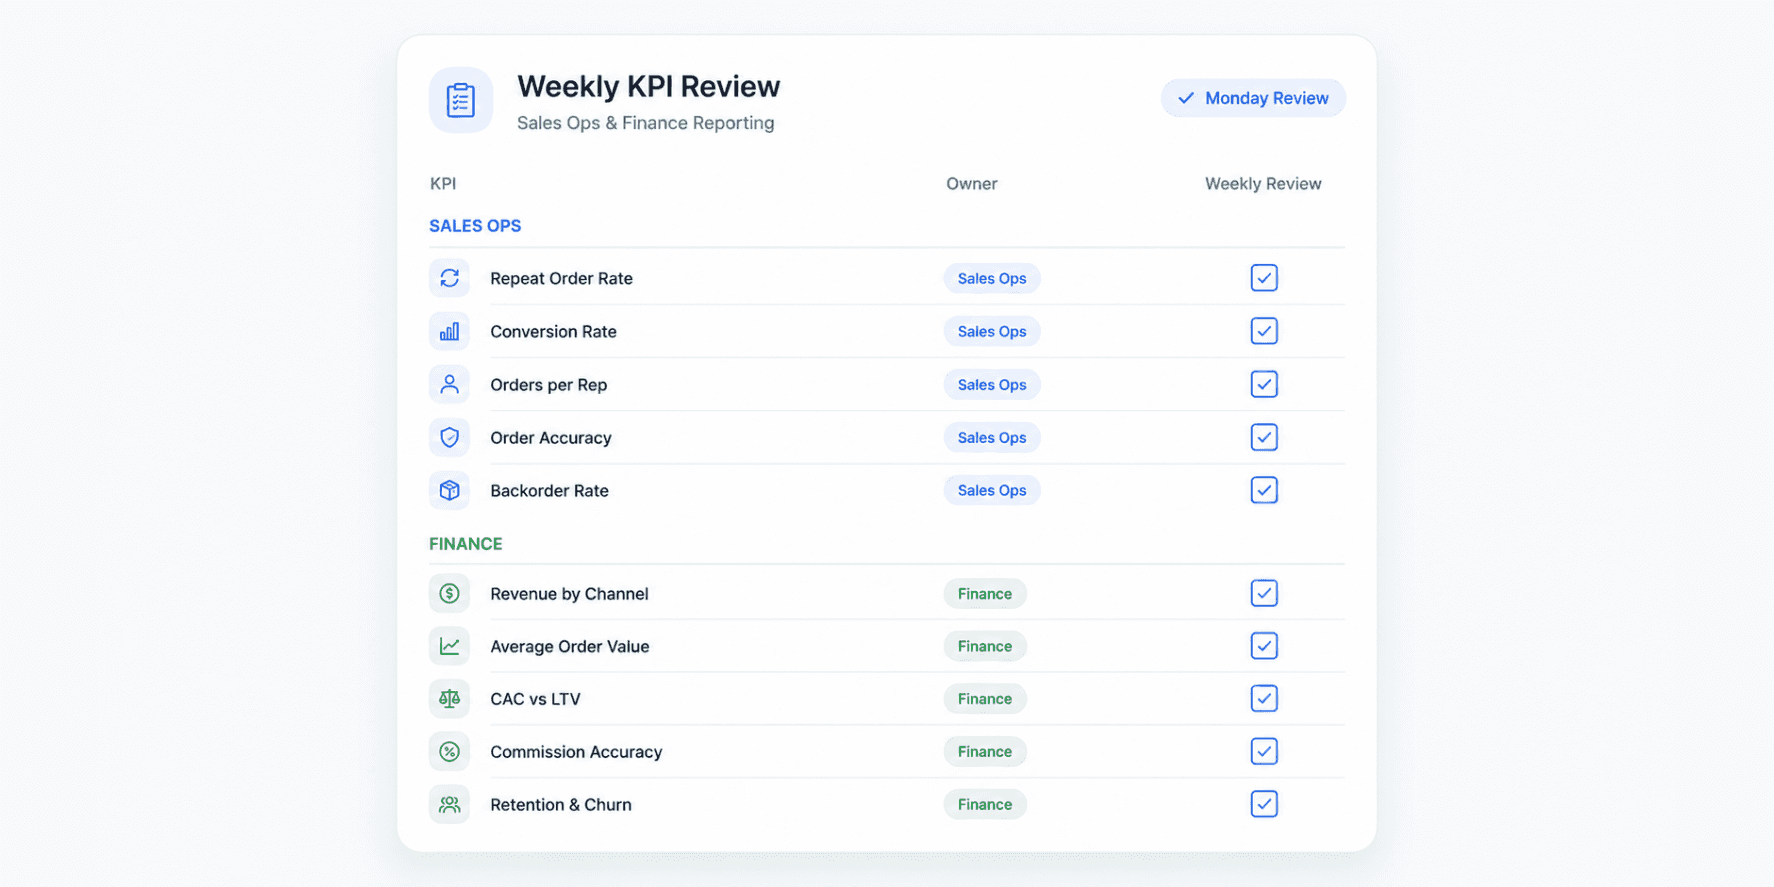
For Sales Ops, every week:
Repeat order rate and average order frequency, by channel
Conversion rate and cart abandonment, online vs rep-led
Orders and revenue per rep, against target
Order accuracy and on-time delivery, flagged by exception
Backorder rate, with the affected customers named
For Finance, every week:
Total revenue by channel, against forecast
Average order value trend
Customer acquisition cost vs customer lifetime value
Commission accuracy and total commission liability
Retention and churn on top customers by revenue
Run this against one system and the review is a conversation about decisions, not a debate about whose number is right. That shift, from reconciling data to acting on it, is the real return on tracking B2B ecommerce KPIs well. It is also the foundation of a dependable sales reporting cadence.
Final Thoughts
The B2B ecommerce KPIs that matter are not exotic. They are the revenue, customer, ordering, fulfillment, and commission metrics every B2B seller should already be tracking. What separates teams that act on these numbers from teams that argue about them is a single source of truth behind every dashboard. When orders from reps, ecommerce, and customer service flow into one platform, your KPIs stay aligned across every channel, and weekly reporting becomes consistent.
Velocity Commerce unifies multi-channel B2B orders so the numbers behind every KPI share one definition and one source. If your team spends more time reconciling reports than acting on them, book a Velocity demo and see your order, customer, and commission data in one connected platform.
FAQs
What are the key KPIs for ecommerce?
The core ecommerce KPIs are average order value, conversion rate, customer lifetime value, customer acquisition cost, retention rate, and cart abandonment rate. For B2B sellers, repeat order rate, order accuracy, and on-time delivery matter just as much, because the business runs on long-term reordering relationships rather than one-time purchases.
What are the KPIs for B2B products?
B2B product KPIs center on revenue durability and order health: average order value, revenue by channel, customer lifetime value, retention rate, repeat order rate, order accuracy, and backorder rate. These reflect the larger orders and recurring contracts that define B2B, and they are most reliable when every channel reports into one order management system.
What KPIs should a B2B ecommerce business track weekly?
A practical weekly set includes repeat order rate, conversion rate, orders and revenue per rep, order accuracy, on-time delivery, and backorder rate for Sales Ops, plus revenue by channel, average order value, and commission accuracy for Finance. Weekly tracking only works when the underlying order data is unified, so the same number holds from Monday to Friday.
How are B2B ecommerce KPIs different from B2C?
B2B KPIs place greater emphasis on retention, repeat order rate, and customer lifetime value more heavily than B2C, because revenue comes from recurring contracts and reorders rather than one-time sales. B2B also tracks rep and commission metrics and multi-channel order accuracy, since a single customer often orders through reps, ecommerce, and customer service at the same time.